Does your School District Adequately Budget for Facilities? Here’s How to Tell.
Written by Mary Filardo, Executive Director, 21st Century School Fund,
In this post, Mary Filardo explains the three data points and a simple formula that can tell you whether your district’s facility maintenance and capital budgets are adequate. Filardo is the lead author of the 2025 State of Our Schools: America’s K–12 Facilities.
Public PK-12 school facilities constitute one of the largest non-residential building sectors in the country: close to 100,000 schools, hundreds of thousands of buildings, and billions of square feet serving nearly 50 million students. And spending on those buildings is non-trivial: In fiscal year 2023 across the U.S., district spending on school facilities totaled roughly $180 billion—$72 billion on maintenance and operations, $84 billion on construction and capital equipment, and $24 billion on interest.
Yet most states and school districts do not apply standards for gauging whether their facility budgets and expenditures are adequate. The result? Facilities budgeting too often fails to reference standards for facility age, condition, and use, which means districts may not get the best value for the facility expenditures they are making.
Fortunately, there is a simple and no-cost method for using a stewardship key performance indicator (SKPI) to estimate the funding required to support modern health, safety, education, and environmental conditions in our public schools.
See what your state and school district have spent on facilities over the last few decades by visiting the National Center on School Infrastructure’s Interactive Data Dashboard on Public School Facilities Funding. The Dashboard provides 28 years of local education agency (LEA)-level data on maintenance and operations, capital outlay, long-term debt, and interest—organized by state and district. It’s a quick way to see your district’s spending history.
Three Key Numbers
A stewardship key performance indicator (“SKPI”) uses three data points in a simple formula to estimate what your school district should spend annually on maintenance and operations (M&O) and capital renewal. This good stewardship estimate is then compared to what your district actually spends on M&O and capital renewals. If these numbers are fairly close, chances are your facilities are in good working order and adapted to current needs. If actual spending is well below the SKPIs, this explains why deferred maintenance is piling up, why your facilities systems have deteriorated, and/or why your facilities are not adapting to new education, security, health, or energy demands.
Three data points are all you need:
1. Gross Square Footage (GSF): How much building space is the district responsible for? Size (i.e., square footage of schools and other district facilities) drives the cost of cleaning, utilities, maintenance, repairs, groundskeeping, and construction—even more than enrollment does. A district with 2 million square feet faces roughly twice the facility costs of one with 1 million square feet, regardless of student enrollment.
2. Current Replacement Value (CRV): What would it cost per square foot to replace the district’s facilities today, built to current standards (i.e., health, safety, accessibility, energy, security, and educational function)? Calculating the CRV doesn’t presume you will demolish your buildings, but it provides a way to place a monetary value on what you own against what it would cost to rebuild it today to serve the same function(s).
Construction costs vary by facility type: high schools usually cost more to build than elementary schools. Construction costs also vary by region, so CRV should reflect local market conditions (labor, materials, and equipment). Replacement costs will also vary depending on the quality of the design, materials, and construction: hallways with sheetrock finishes will cost less than those with glazed-brick finishes. Lastly, CRV also shifts over time as standards change: ADA compliance, asbestos abatement, new air quality standards, and evolving security infrastructure are all common elements baked into the cost of building and maintaining a modern school.
3. Annual Depreciation Rate (Expected Lifespan): How long is the useful life of any school building, system, or component, and at what rate do they age? A slate roof may last 100 years; a built-up membrane roof, only 20. Boilers, HVAC units, windows, flooring, electrical systems, and technology all have different expected useful lifespans and depreciate on different schedules. Lifespan assumptions turn predictable wear and tear into a planned budget rather than a never-ending series of surprise repairs.
Expected lifespan should be estimated using an annual depreciation rate expressed as a percentage. A depreciation multiplier of 1% corresponds to a 100-year expected lifespan for a building or component; a 4% depreciation multiplier corresponds to a 25-year expected lifespan. The figure below shows the recommended building industry standards for school depreciation rates, as applied to K12 public school buildings.
Building Industry Standards for School Depreciation Rates
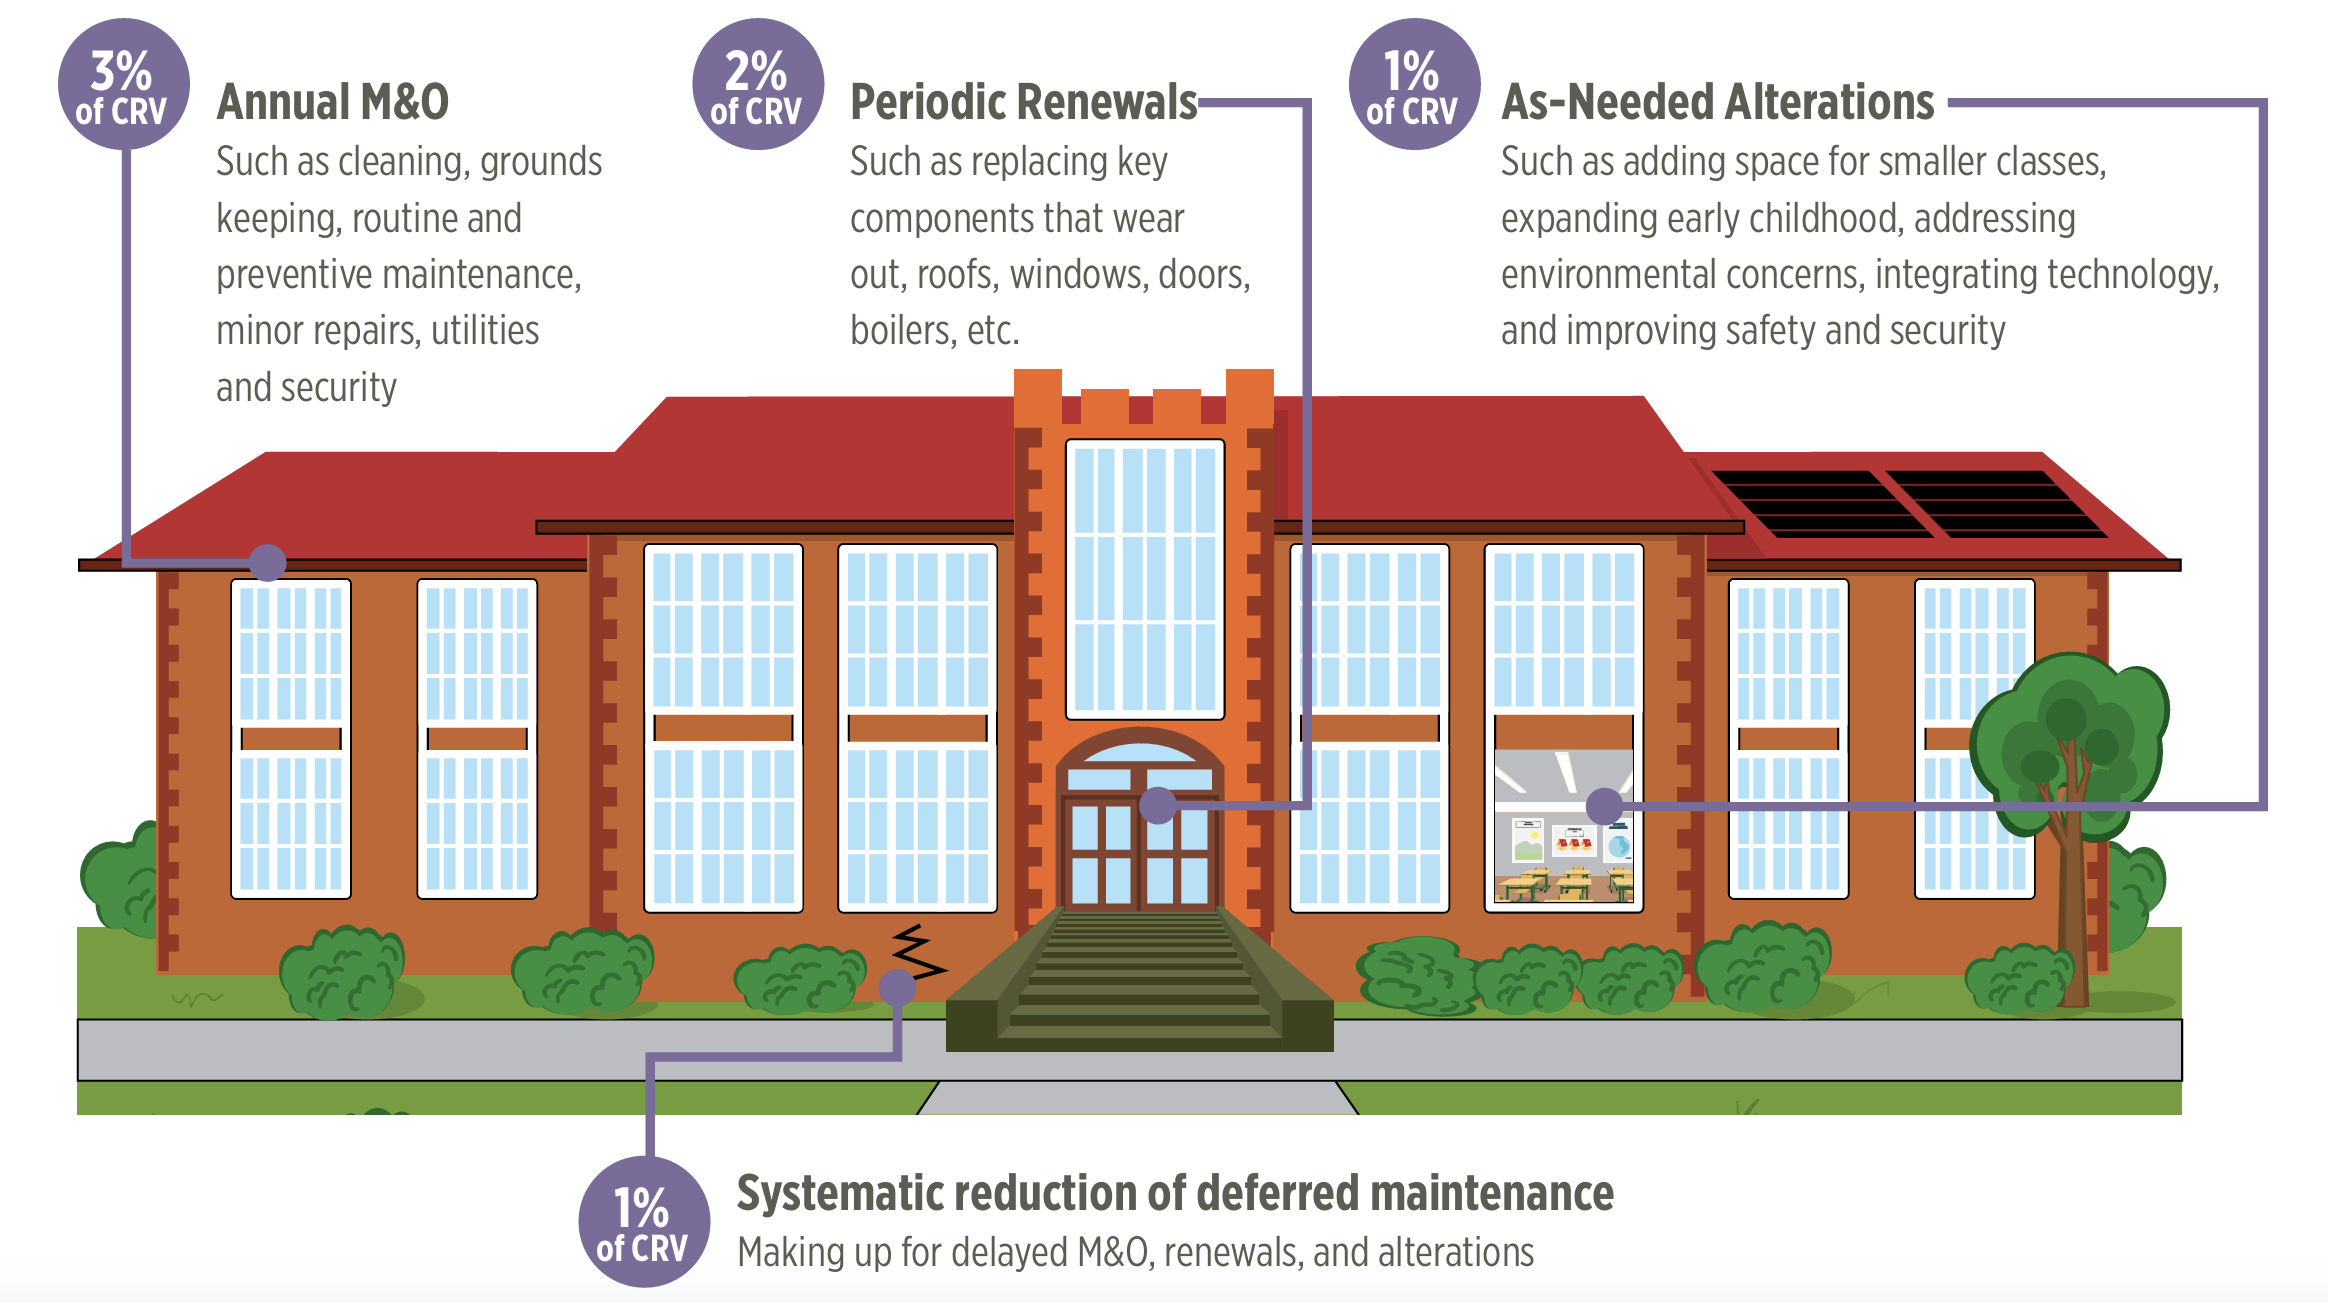
As illustrated below, school districts should spend about 7% of the CRV of their facility portfolio each year on M&O and capital outlay combined; this figure accounts for annual maintenance and operations, periodic renewals, as-needed alterations, and systematic reduction of deferred maintenance.
A Simple Formula to Evaluate Facility Budgets
Once you have the three key data points, a simple formula is all you need to determine your SKPI and evaluate your school district’s facility budgets:
School District GSF x CRV per GSF x Depreciation Rate
=
Annual SKPI Benchmark for M&O or Annual SKPI Benchmark for Capital Outlay
The Formula in Practice
What does this look like in practice? Consider, for example, a mid-sized suburban district in a growing county. The district has about 2.4 million GSF across 16 schools. If the current replacement cost in their region is $450 per square foot, the district’s facility portfolio’s Current Replacement Value (CRV) is $1,080,000,000.
Example 1: Mid-Sized Suburban District
| Facility Responsibility Categories | Depreciation Rate | Annual SKPI Benchmark | District Actual Expenditures FY2024 | Difference between Actual and Benchmark |
| Maintenance & Operations | 3% of CRV | $32.4 million | $14.8 million | -17.6 million |
| Capital Renewal & Modernization | 2-4% of CRV | $21.6-$43.2 million | $31.1 million | +$9.5 to $12.1 million |
| Combined M&O and Capital Renewal & Modernization | 5-7% of CRV | $54-$76.6 million | $45.9 million | -$8.1 to $29.7 million |
The SKPI benchmarks don’t tell you which roof to replace first or whether to prioritize an HVAC overhaul at the middle school. Those types of decisions require school-specific facility condition assessments, work order information, system performance data, and input from the building occupants. What the SKPIs do tell you is whether the district’s budget is in the right range to meet good stewardship standards—or whether it’s so far below the target range that deferred maintenance will accumulate and systems and components beyond their life may start to fail.
So in the example above, while the district’s level of capital spending is well within the SKPI range, the M&O spending is low. M&O spending below standard can indicate that operations lack efficiency, that preventive and routine maintenance is being neglected, or that custodial services and minor repairs have been given short shrift. These deficiencies create immediate-term negative impacts, such as student and staff discomfort, as well as long-term negative impacts, because they shorten the useful life of building systems and components.
Example 2: Small Rural District
Now consider another example: a rural county school district with enrollment of about 2000 students. The district has 400,000 GSF across 4 schools. If the average current replacement cost in their region is $400 per square foot, the district facility portfolio’s Current Replacement Value (CRV) is $160,000,000.
| Facility Responsibility Categories | Depreciation Rate | Annual SKPI Benchmark | District Actual Expenditures FY2024 | Difference between Actual and Benchmark |
| Maintenance & Operations | 3% of CRV | $4.8 million | $3.5 million | -$1.3 million |
| Capital Renewal & Modernization | 2-4% of CRV | $3.2-$6.4 million | $.6 million | -$2.6 to $5.8 million |
| Combined M&O and Capital Renewal & Modernization | 5-7% of CRV | $8-$11.2 million | $3.9 million | -$4.1 to $7.3 million |
This district is underspending on both capital and M&O. But because their capital budget is well below the SKPI benchmark, they are unlikely to make the necessary building upgrades and system replacements when needed. Instead, the district is putting heavy pressure on its M&O budget just to meet very basic building needs and, as a result, falling way behind.
A recent analysis shows that the U.S. is falling behind by at least $85 billion a year in the care of its public school facilities. However, looking beyond the averages, the analysis finds tremendous variability between states, districts, and even among schools within districts. Importantly, districts with the largest spending gaps tend to be those that predominantly serve low-income children and families, as well as those in rural areas.
Essentials to Keep in Mind
- SKPI is a planning tool, not a compliance standard. A district with newer facilities may be able to spend below the capital benchmark in the near term—but will still need a capital plan. A district with a large deferred maintenance backlog may need to spend above the benchmark for several years. A growing district will need additional capital for new construction beyond what the renewal benchmark covers.
- CRV must reflect local conditions. National averages mask substantial regional variation. Construction in rural Alaska or dense urban markets can cost two to three times the national average. A CRV that doesn’t reflect your market cannot produce a viable benchmark.
- SKPIs are not a substitute for a facility condition assessment. The SKPI tells you the scale of investment required; a condition assessment tells you where to direct it. Both matter.
- Age and obsolescence are separate problems. There is a difference between physical deterioration—systems wearing out—and educational or technical obsolescence—buildings designed for a different era of instruction, technology, or safety. Both drive capital costs, and both are embedded in the CRV-based benchmark.
- SKPIs address budget standards only for existing facilities. The SKPI formula used here accounts for budgeting for the existing square footage of school district facilities. If a new school or additions need to be built, this new square footage should be added to the existing GSF and then rerunning the formula will adjust the capital and M&O budget requirements.
With a few basic data points – how much building space a district owns, what it would cost to replace that space, and how long buildings and systems are expected to last – school districts (and states) can create practical benchmarks for maintaining and renewing public school facilities. These SKPIs can help educational leaders and the public understand whether current investments are adequate, whether buildings are being cared for responsibly, and where additional resources might be needed. It invites public and school district engagement to find ways to address the gaps between historic spending and the modern school facility standards.
Remember, the goal isn’t a perfect number. It’s a working benchmark—one you can update, defend, and use to make the case that school buildings deserve the same accountability standards as everything else in public education.